|
|
|
|
|
|
OPTIMUM
PID CALCULATION
Examples
based on Zieglar-Nichols's tuning rule
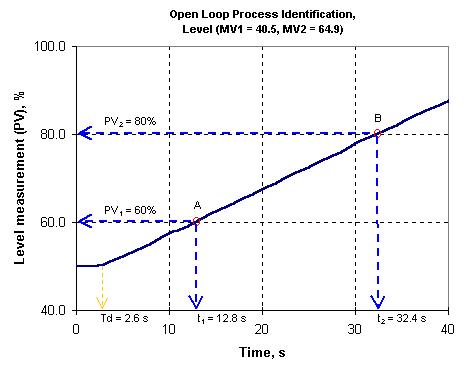
1. Example using data captured using a paperless recorder of a level increasing process
3. Example using data captured using a chart recorder of a level increasing process
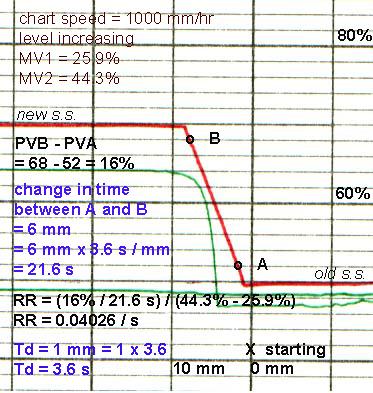
1. Chart speed = 1000 mm
/ hr = 3.6 s / mm
2. x-axis (time's scale)
= 10 mm = 36 s , y-axis (measurement's scale) = 10 mm thick
mark = 10 %
3. Td = 1 mm = 3.6 s
4. Time difference between
point A and B = 6 mm = 21.6 s
5. Process rate = (68% -
52%) / 21.6 s = 0.7407 % / s
6. Controller output change
= MV2 - MV1 = 44.3% - 25.9% = 18.4%
7. RR = process rate / step
input = 0.7407 / 18.4 = 0.04026 / s
8. Level process ==> Mode
= PI
P = 111.1
x 0.04026 x 3.6 = 16.1%
I = 3.33
x 3.6 = 12 s
TEST YOUR SELF: Can you calculate the optimum PI for this level decreasing process